


Welcome to part 2 of the e-commerce report for 2022. If you missed part I, you can find it here.
Most frequently purchased
The e-commerce report shows that at least 50% of surveyed people declare the following as their most frequently purchased items: clothing, footwear, cosmetics, perfumes, books, music, and pharmaceutical products, as well as consumer electronics and home appliances. Women more often go for clothing, footwear, cosmetics, pharmaceutical and children's products, furniture, and interior decor items. Men, in turn, buy electronics and appliances, smartphones and accessories, car parts, computer hardware and software more often.
For purchases on foreign websites, clothing dominates, followed by footwear, sportswear, cosmetics and toys, and children's products.
Importantly, people under 34 plan purchases across most categories much more often than respondents from the other age groups.
The ROPO effect and reverse ROPO
The ROPO effect (researching products online, then buying them in brick-and-mortar stores) can be observed in categories such as: building and finishing materials, footwear, pharmaceutical and grocery products, as well as electronics and appliances, clothing, and phones and accessories.
The reverse ROPO effect (researching a product in brick-and-mortar stores, then buying it through an online store) applies primarily to cosmetics, clothing and footwear.
Online spending
Respondents spend the most on clothing, add-ons and accessories, as well as groceries. Spending on clothing is spread fairly evenly across the groups. However, people who rate their current financial situation better spend more. For groceries, people who rate their financial situation better spend more, as do respondents in the 25-34 age group.
The next groups in terms of spending are footwear, children's products and toys, and cosmetics. These are followed by pharmaceutical products, then books, music and films, and cinema and theater tickets. In this last category the biggest spenders are in the 50+ group.
55% of respondents declared that their online shopping spending will not change in the near future. Almost 25% declare that the volume of their online purchases will grow, and 10% believe it will decrease.
Shopping on mobile devices
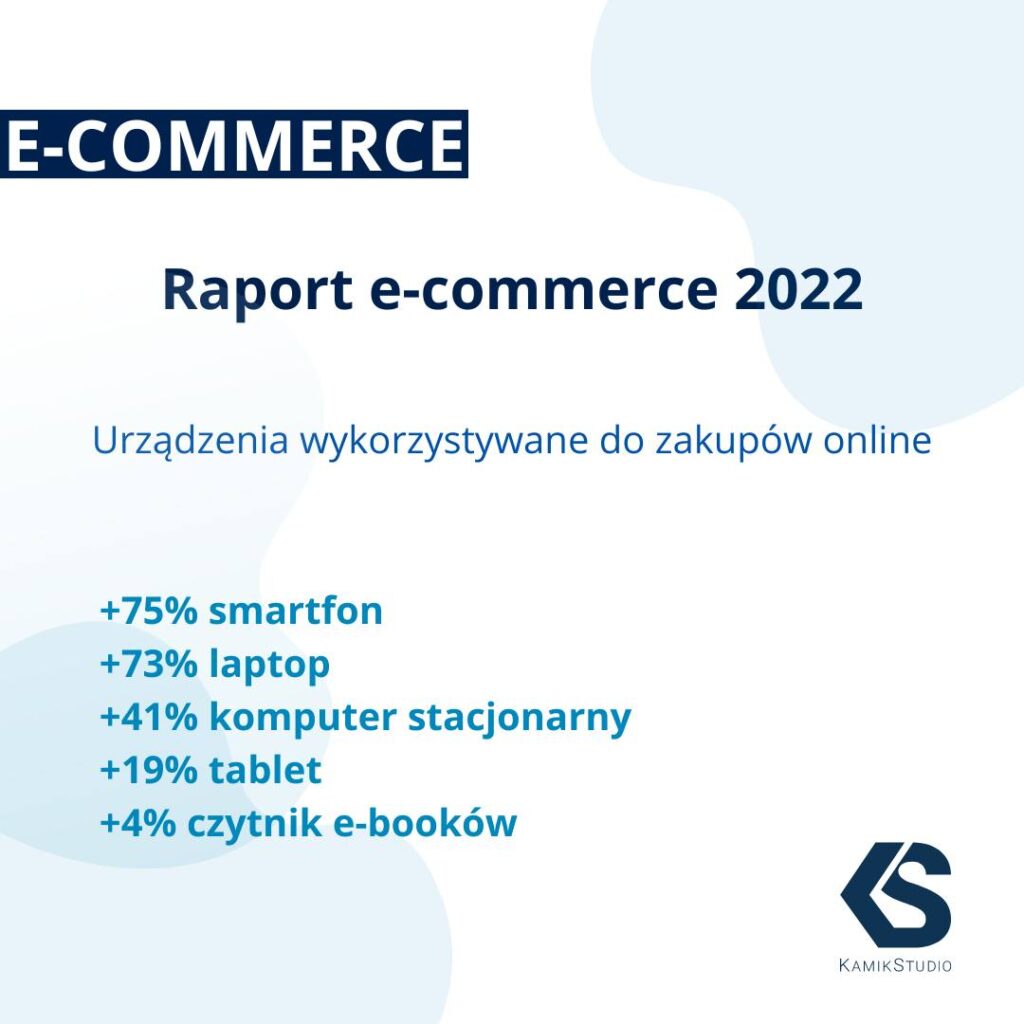
For the first time in the history of the study, the smartphone took the lead, slightly overtaking laptops. It has thus become the most popular device used for online shopping. Further down are desktop computers, used by 4 in 10 respondents. Tablets take the next spot.
As many as 92% of respondents in the youngest group indicate that the smartphone is what they use for shopping, followed by the laptop indicated by 71% of respondents.
Importantly, as many as 80% of respondents shopping by phone say they ran into difficulties during the purchasing process. They most often point to inconvenient forms and websites not adapted to mobile devices. For people under 24, the difficulty is the lack of a mobile app and an inconvenient payment method. For people over 50, the difficulty is font sizes that are too small.
Non-buyers online
23% of respondents declared that they do not shop online. This result has held steady since the previous study. As the main reason (41%) they point to preferring physical contact with the product before making a purchase decision.
For people over 50, the main reason for buying in traditional stores is that they prefer talking to a salesperson in person. They also worry about payment security and warranties.
Motivators that could change the approach of online non-buyers include lower product prices, lower delivery costs, promo codes, and faster delivery times.
The products they would be interested in are clothing, footwear, electronics and appliances, cosmetics, as well as books, music, sportswear, children's products, plus computer hardware and car parts.
Marketing
43% of respondents declared that positive reviews of a product or seller influence them. They also mentioned that they sometimes buy a given product online based on those very reviews. The most susceptible to this kind of suggestion are the youngest respondents and women.
30% of all respondents who shop online declared that online ads are a source of information for them. This is despite the fact that as many as 38% consider such ads annoying. Among the youngest group, that last opinion is shared by as many as 54% of e-consumers.